Observability
To get better visibility into what’s going on in the Café, we’ll use Prometheus, Loki and Grafana
Installation
For this, we’ll use Helm with the upstream Grafana Community Kubernetes Helm Charts and the Prometheus Community Kubernetes Helm Charts respectively.
We’ll use a dedicated namespace for this
kubectl create namespace obs
We configure them using
helm repo add prometheus-community https://prometheus-community.github.io/helm-charts
helm repo add grafana https://grafana.github.io/helm-charts
and then install Prometheus and Loki with defaults to our namespace
helm install prometheus -n obs prometheus-community/prometheus
helm install loki -n obs grafana/loki-stack
For Grafana, we need to provide the correct configuration with the grafana-configmap.yaml
apiVersion: v1
kind: ConfigMap
metadata:
  name: obs-grafana-prometheus-datasource
  labels:
    grafana_datasource: "1"
    app: obs-grafana
data:
  datasource.yaml: |-
    apiVersion: 1
    datasources:
    - name: Prometheus
      type: prometheus
      uid: prometheus
      url: "http://prometheus-server"
      access: proxy
      isDefault: false
      jsonData:
        timeInterval: "30s"
    - name: Loki
      type: loki
      uid: loki
      url: "http://loki:3100"
      access: proxy
      isDefault: false
      jsonData:
        timeInterval: "30s"
and define the options in grafana-options.yaml
adminPassword: secret1234
sidecar:
  datasources:
    enabled: true
    label: "grafana_datasource"
    labelValue: "1"
kubectl apply -n obs -f grafana-configmap.yaml
helm install grafana -n obs grafana/grafana -f grafana-options.yaml
Using a Dashboard
In order for Prometheus to collect the metrics from our services, we need to annotate the containers. We add the following to both Coffee Machine and Servitør
...
spec:
...
  template:
    metadata:
...
      annotations:
        prometheus.io/scrape: "true"
        prometheus.io/path: /metrics
Access the Grafana Interface via Browser. With Minikube and Docker and the open tunnel, all you need is the IP from
kubectl get svc grafana -n obs
Create a dashboard using the UI.
Add a panel of type “Status history” with datasource “Prometheus” and metric
coffee_machine_status.Add a panel of type “Time series” with datasource “Prometheus” and metrics
orders_received,orders_readyandorders_retrieved.Add a panel of type “Time series” with datasource “Prometheus” and metrics
job_queue_lengthandcount(coffee_machine_status).Add three panels of type “Logs” with datasource “Loki” and use the queries
{app=~"schildcafe-barista"} | json | line_format `{{.log}}` | json | line_format `{{.short_message}}` | __error__!="JSONParserErr"
{app=~"schildcafe-coffee"} | json | line_format `{{.log}}` | json | line_format `{{.short_message}}` | __error__!="JSONParserErr"
{app=~"schildcafe-servitor"} | json | line_format `{{.log}}` | json | line_format `{{.short_message}}` | __error__!="JSONParserErr"
Now send in some orders and retrieve them while watching the Dashboard!
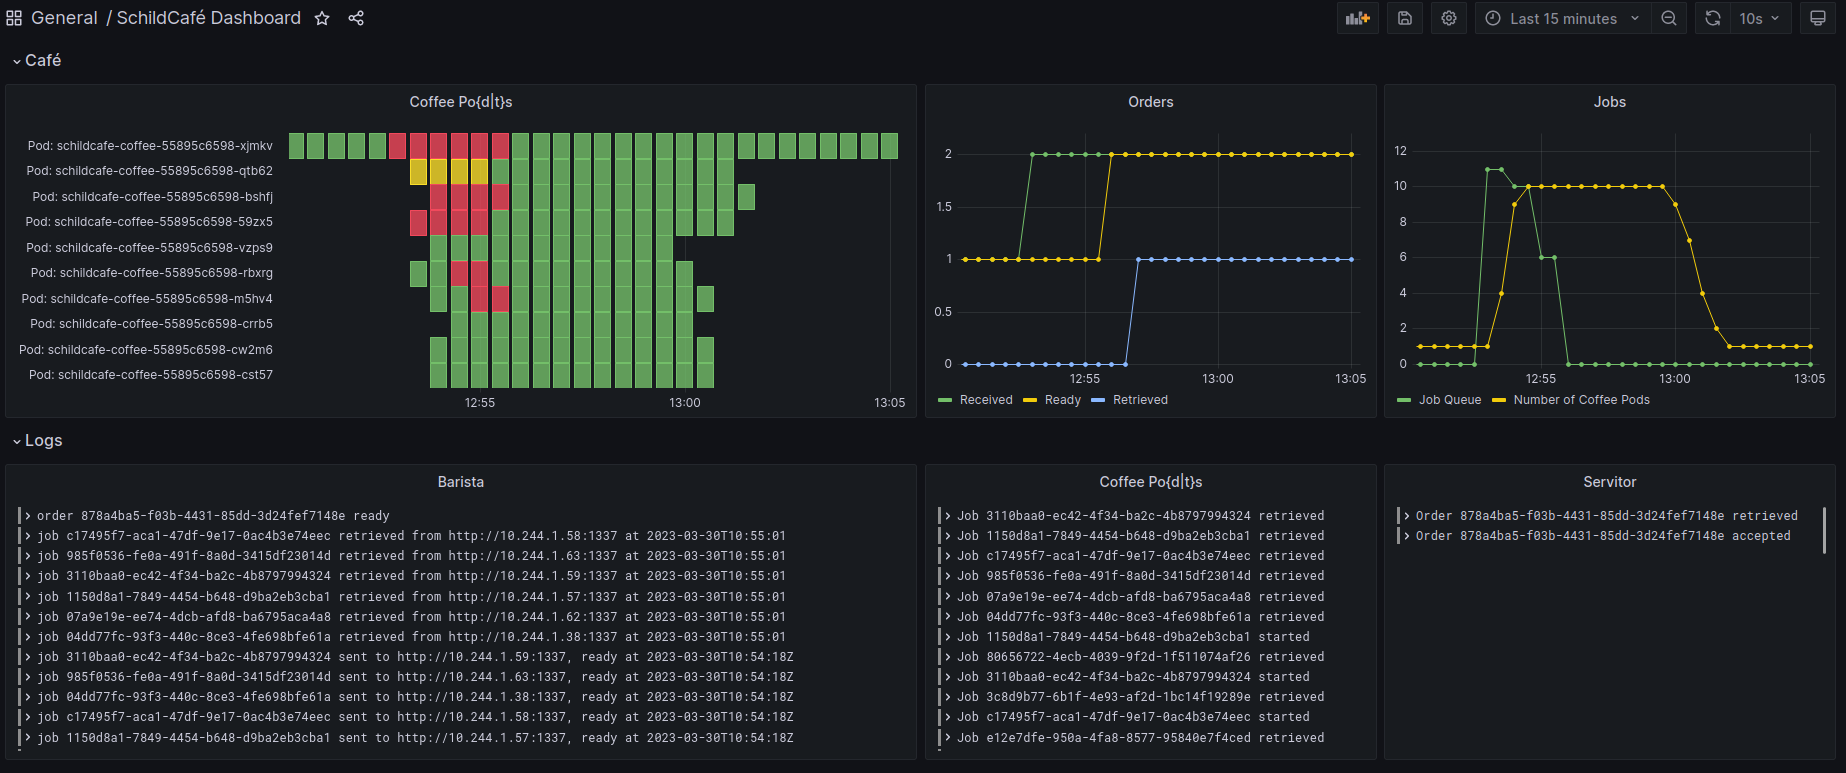
A sample dashboard for the SchildCafé.